Teaching a model to see what a planner sees: disorder, neglect and care, one street-view frame at a time.
Background
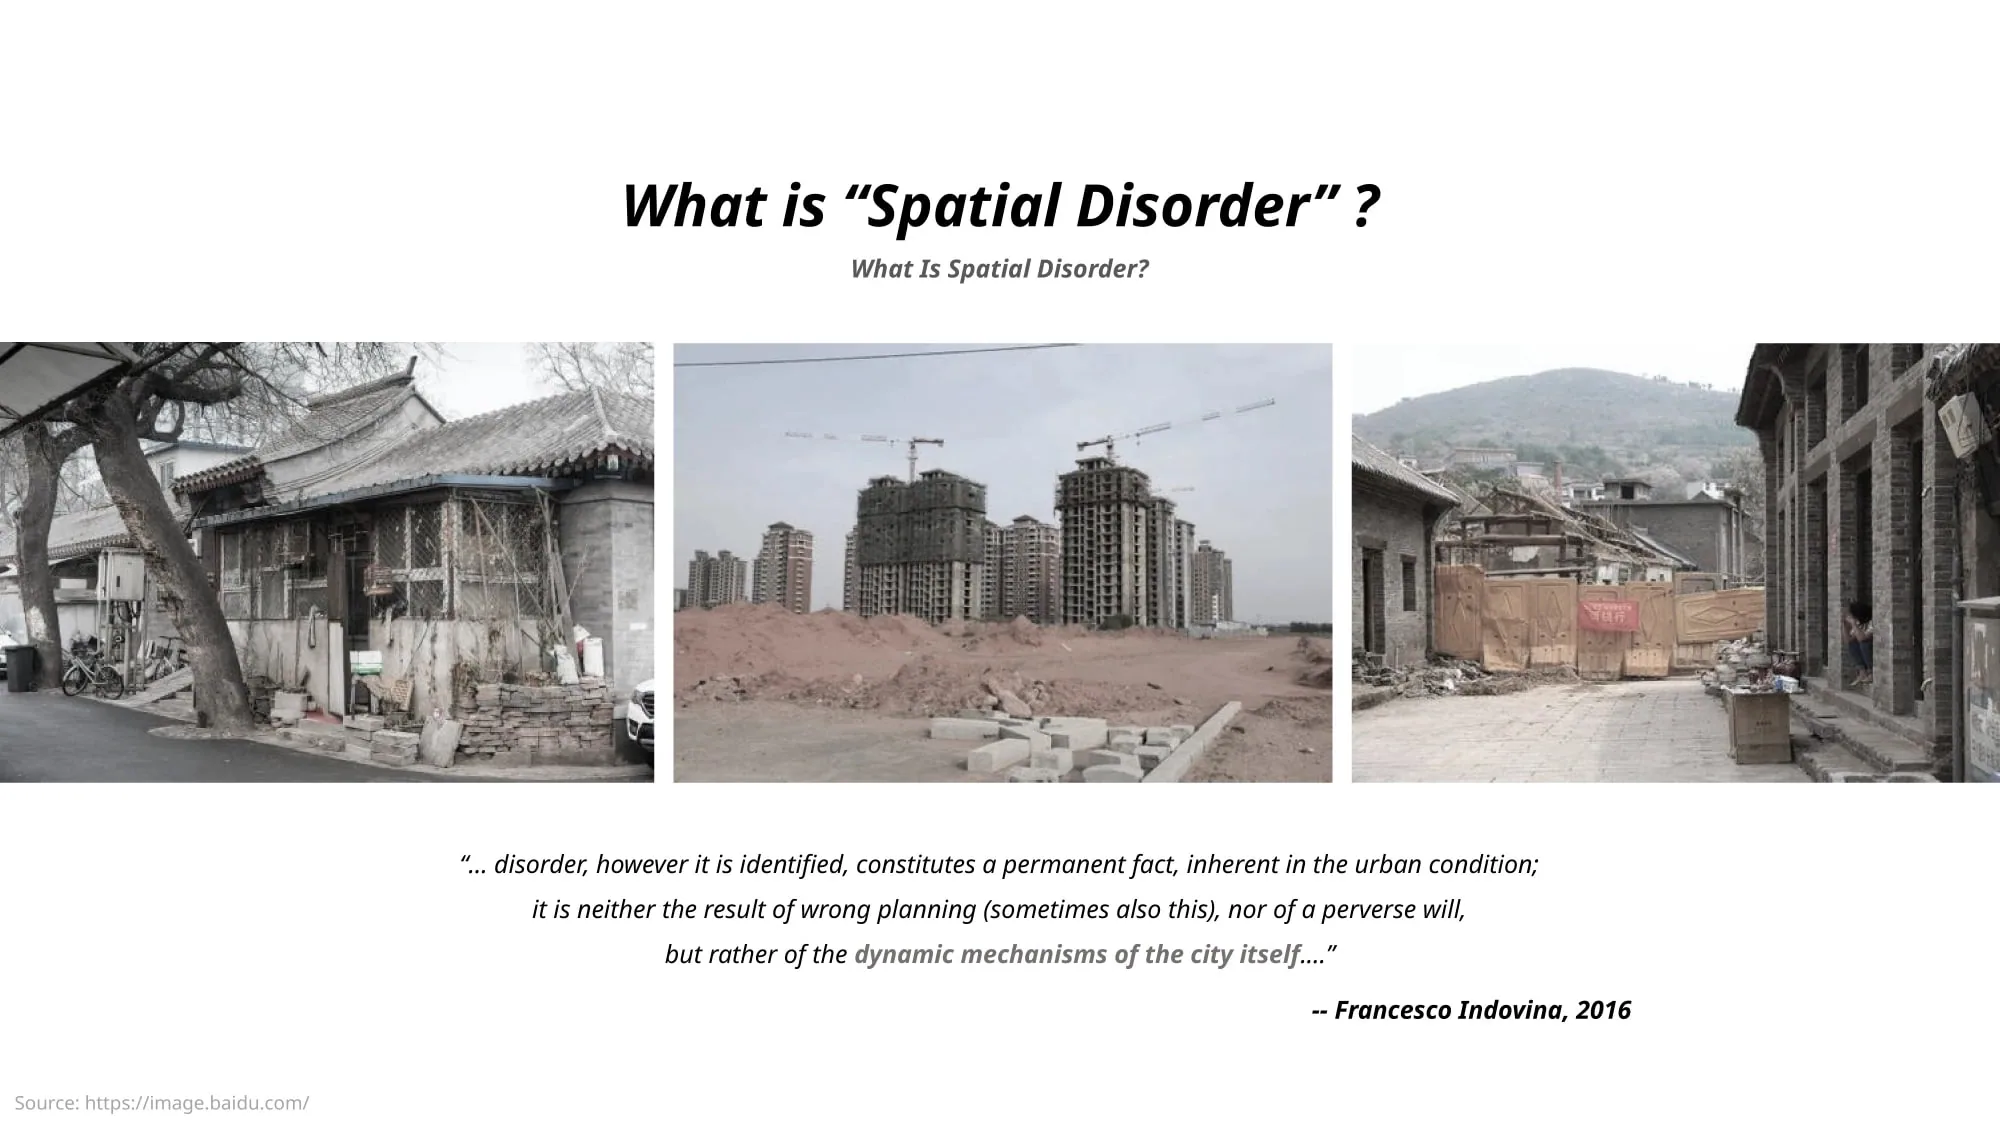
The concept of spatial disorder emerged early in Western research, describing “the physical and social environmental cues that disrupt the normal use of residential life and neighborhood public spaces” (Skogan, 1990). It often signals a breakdown of spatial order and social control, with negative consequences for individuals and for society. Amid rapid urbanisation, measuring and managing the quality of the built environment remains a central planning question — this project asks how to measure a quality of urban space that has so far escaped measurement.
Approach
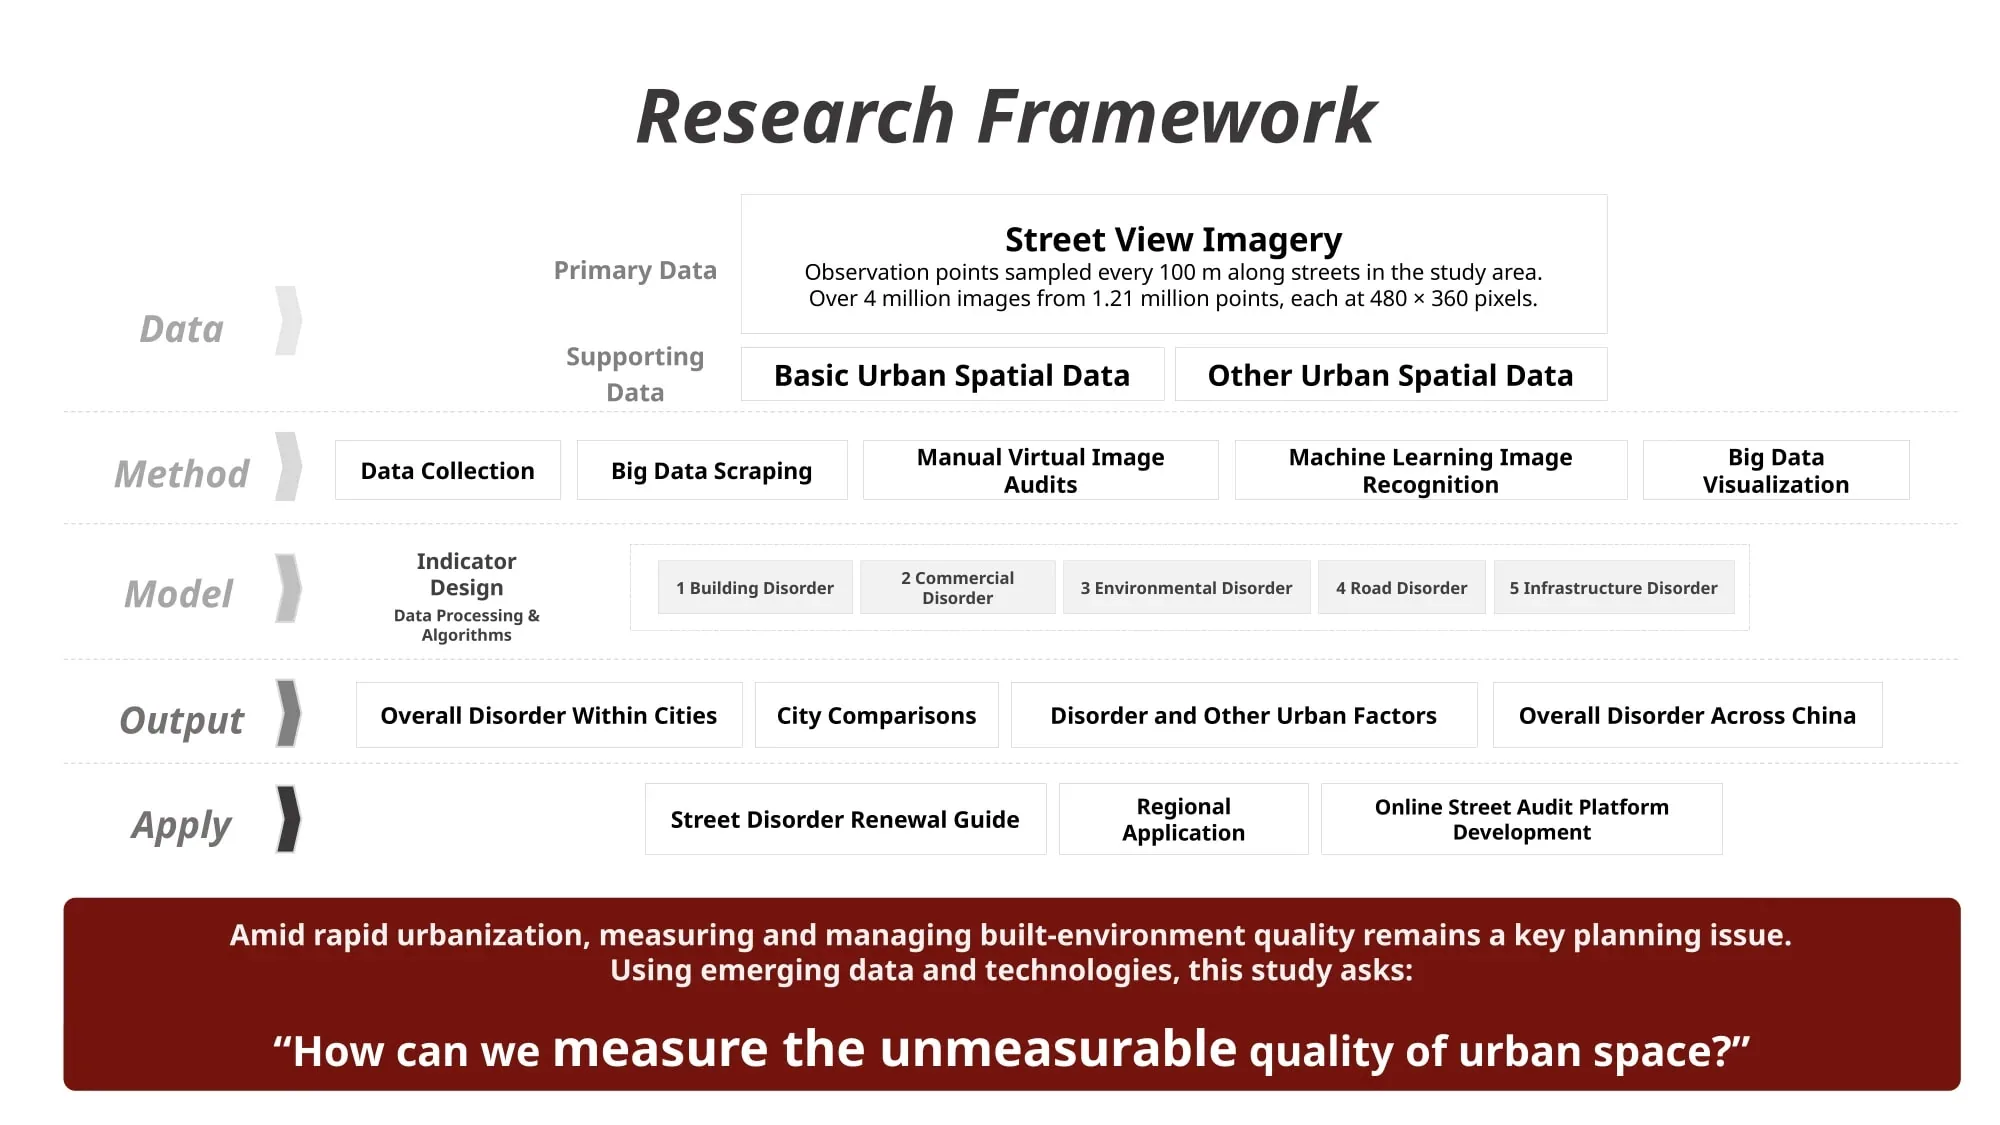
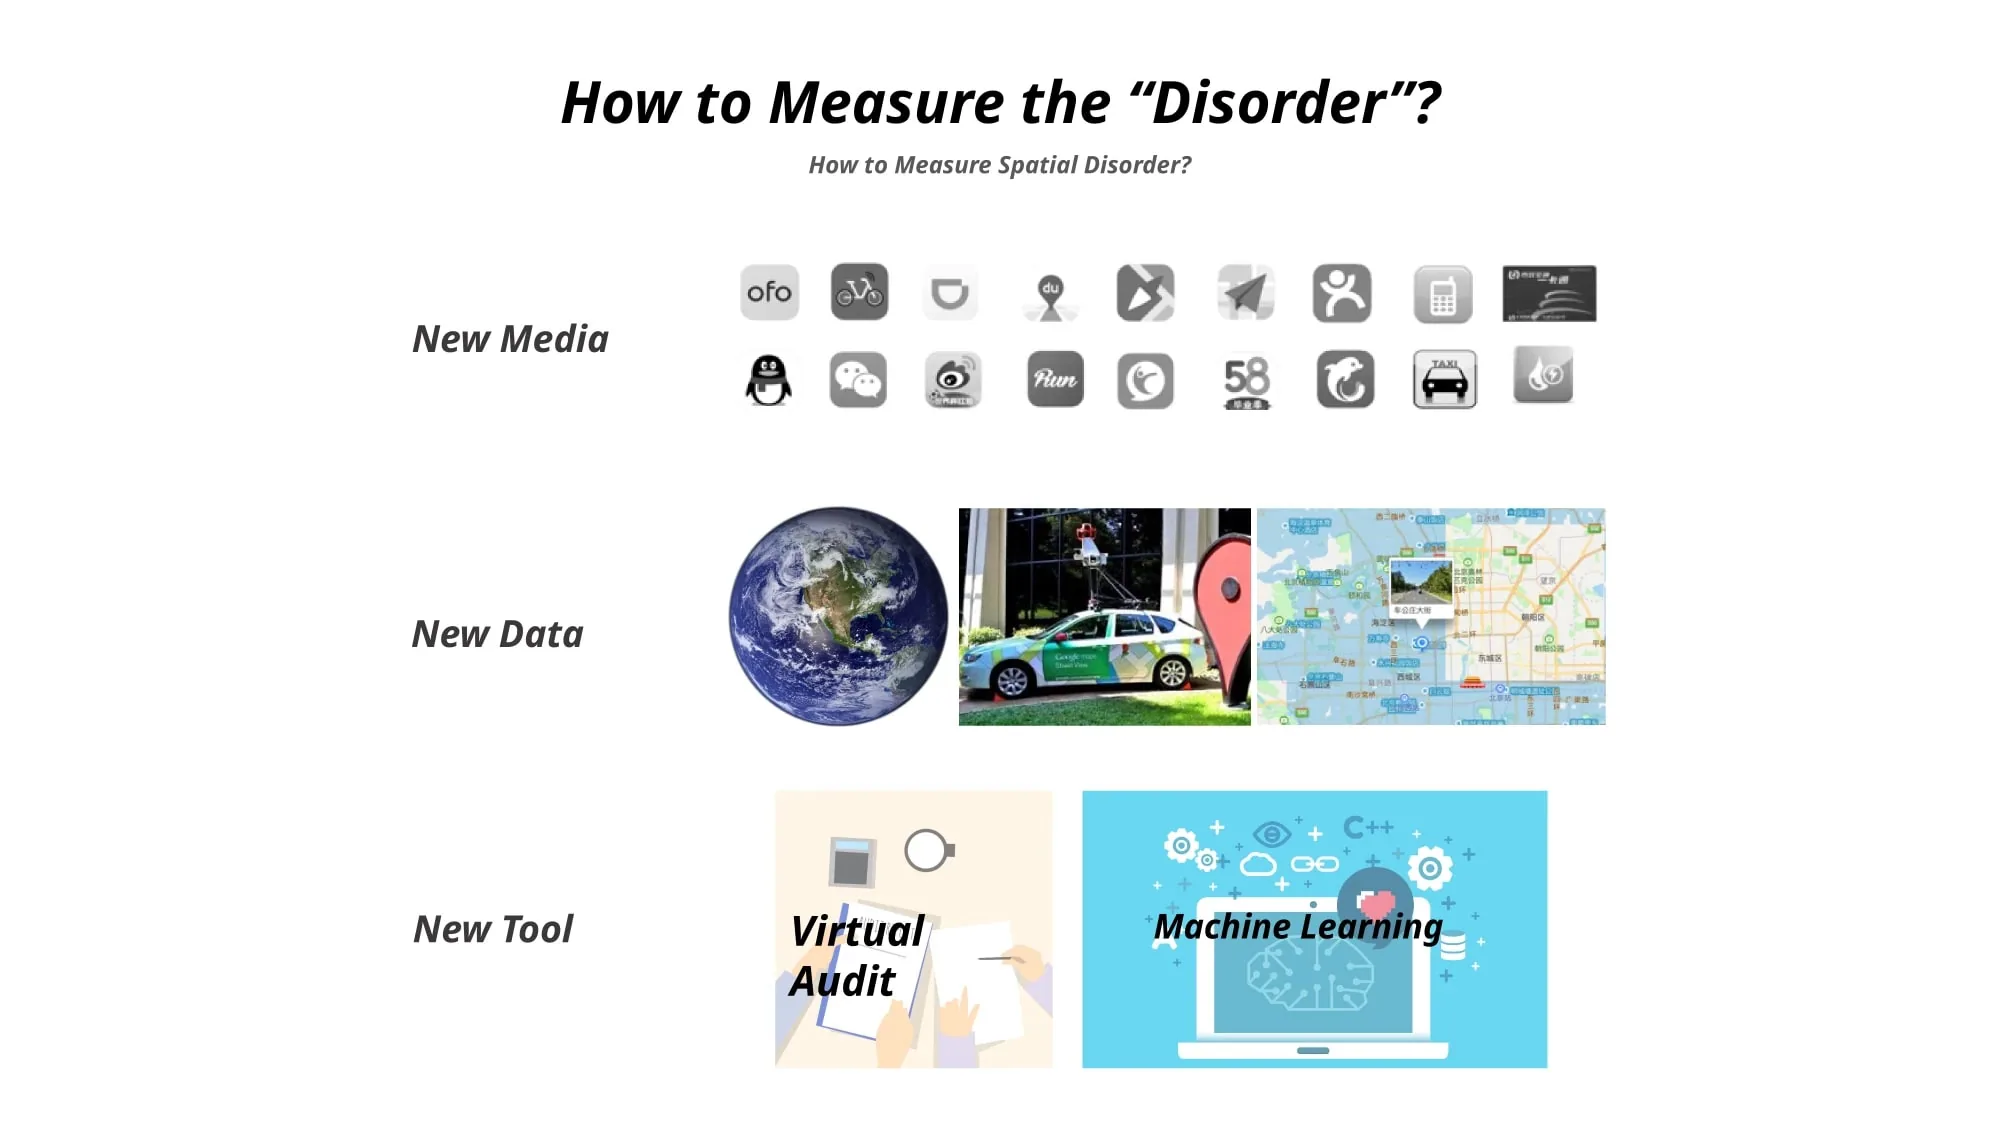
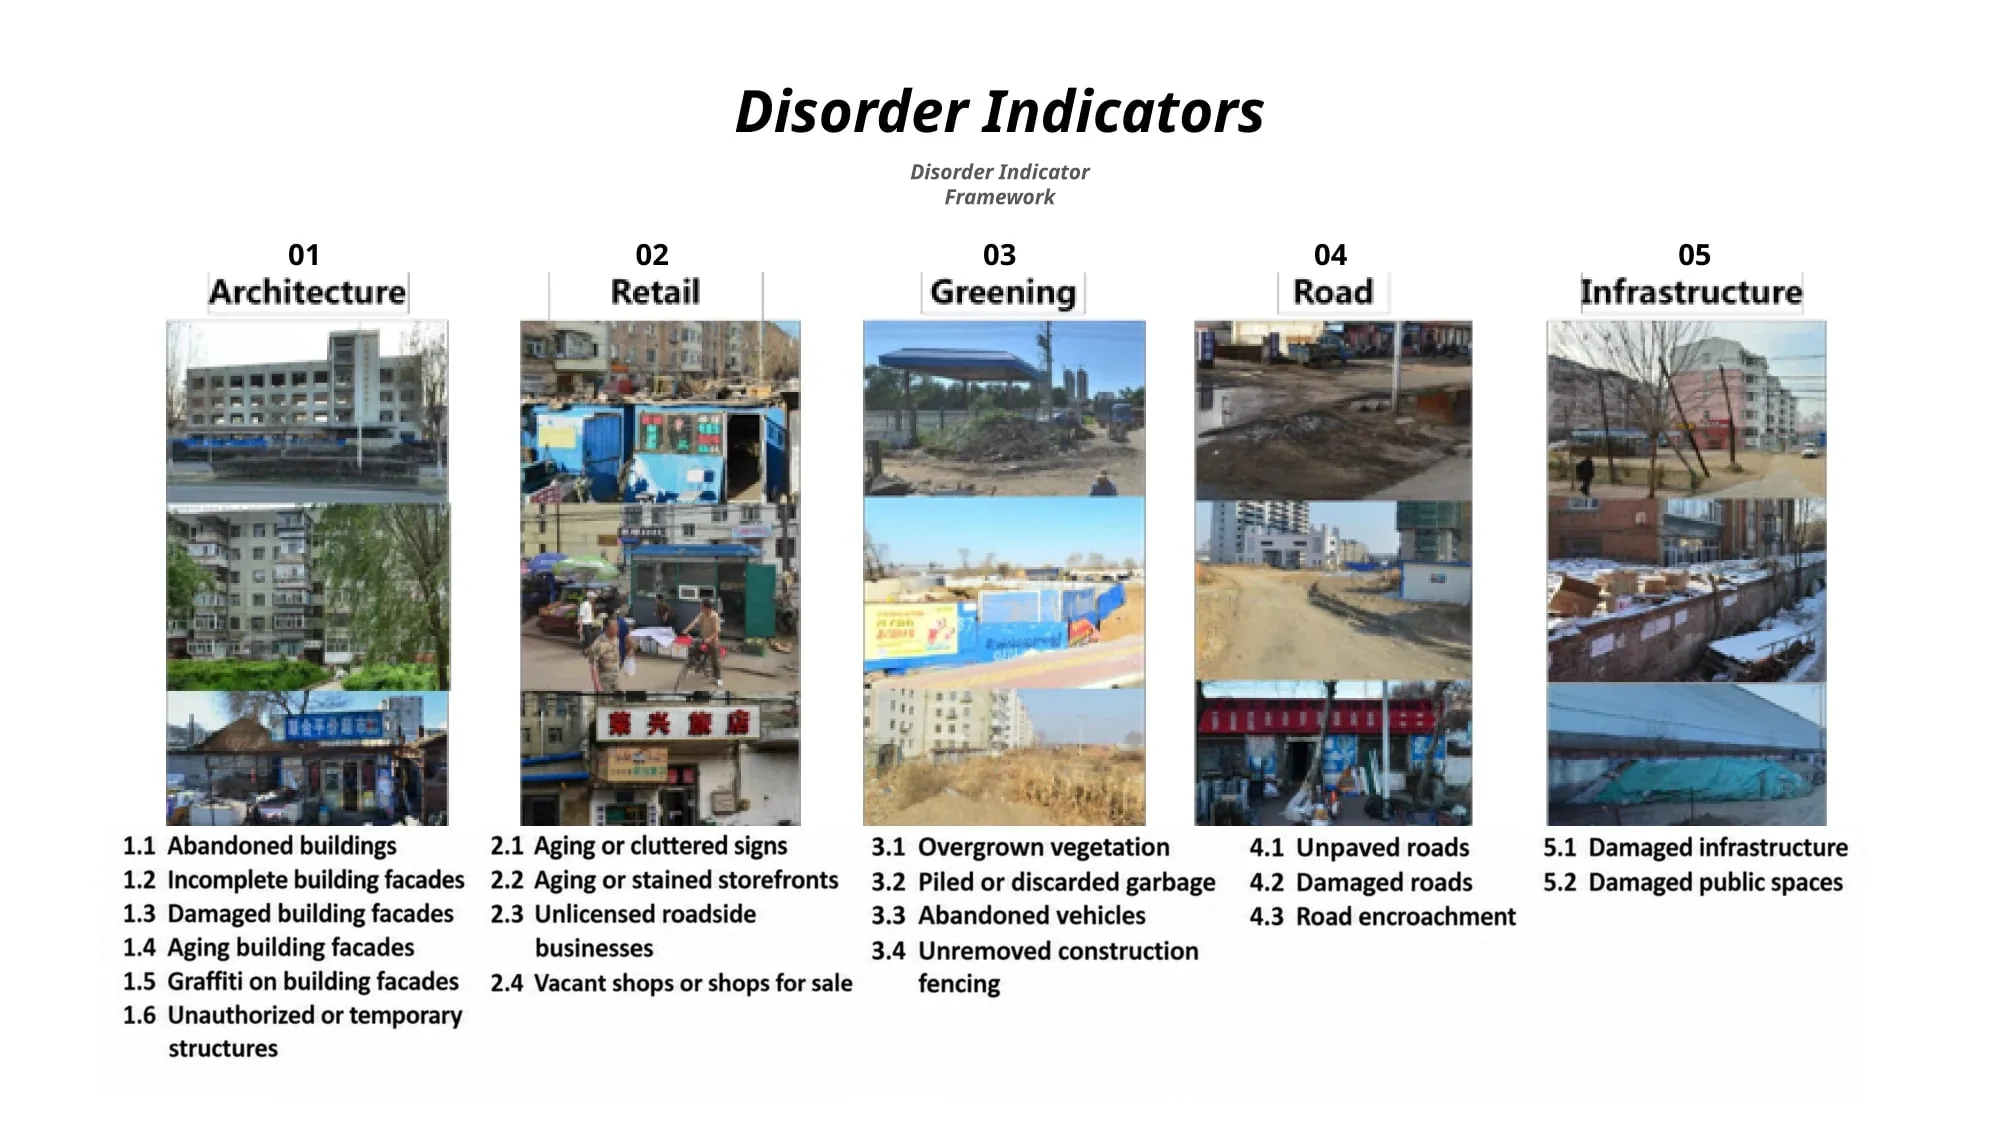
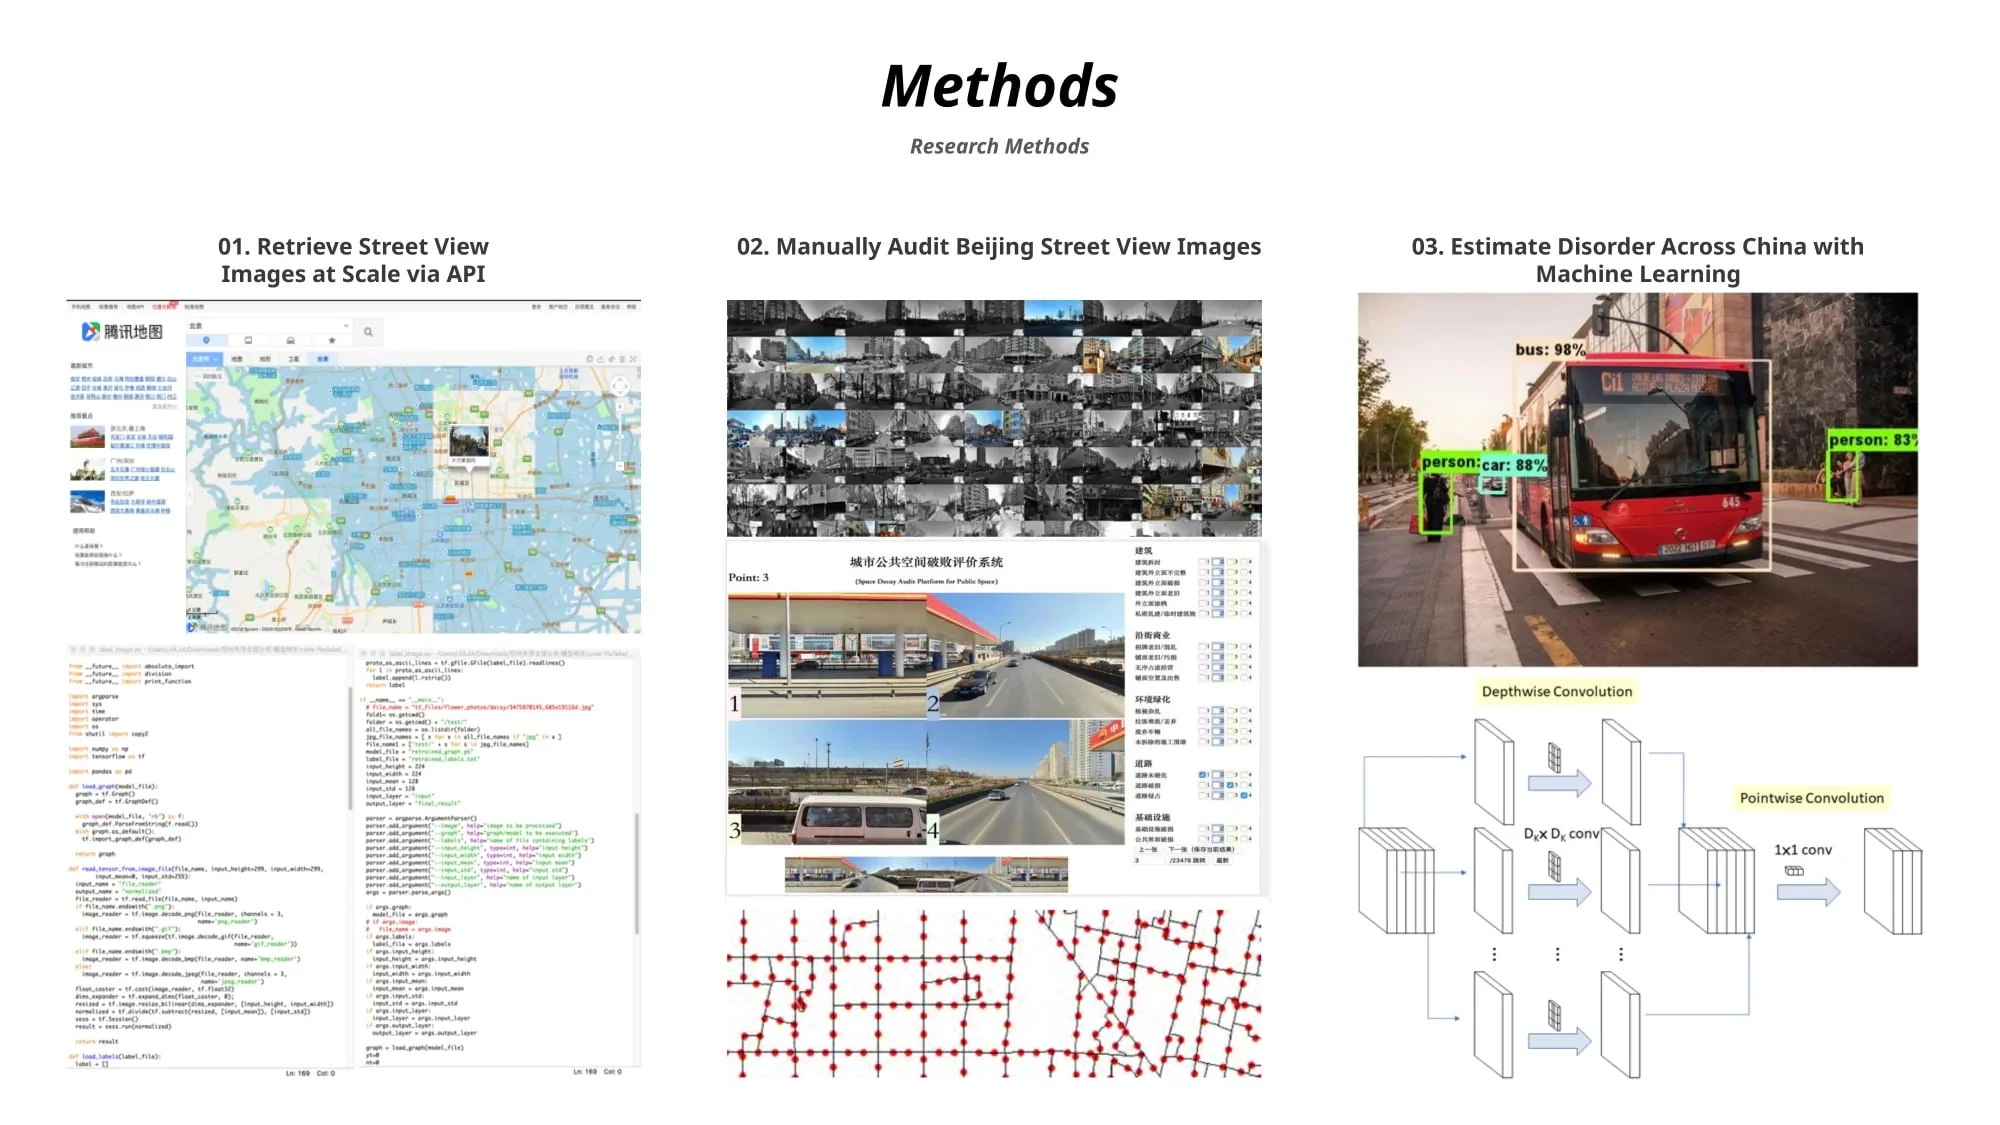
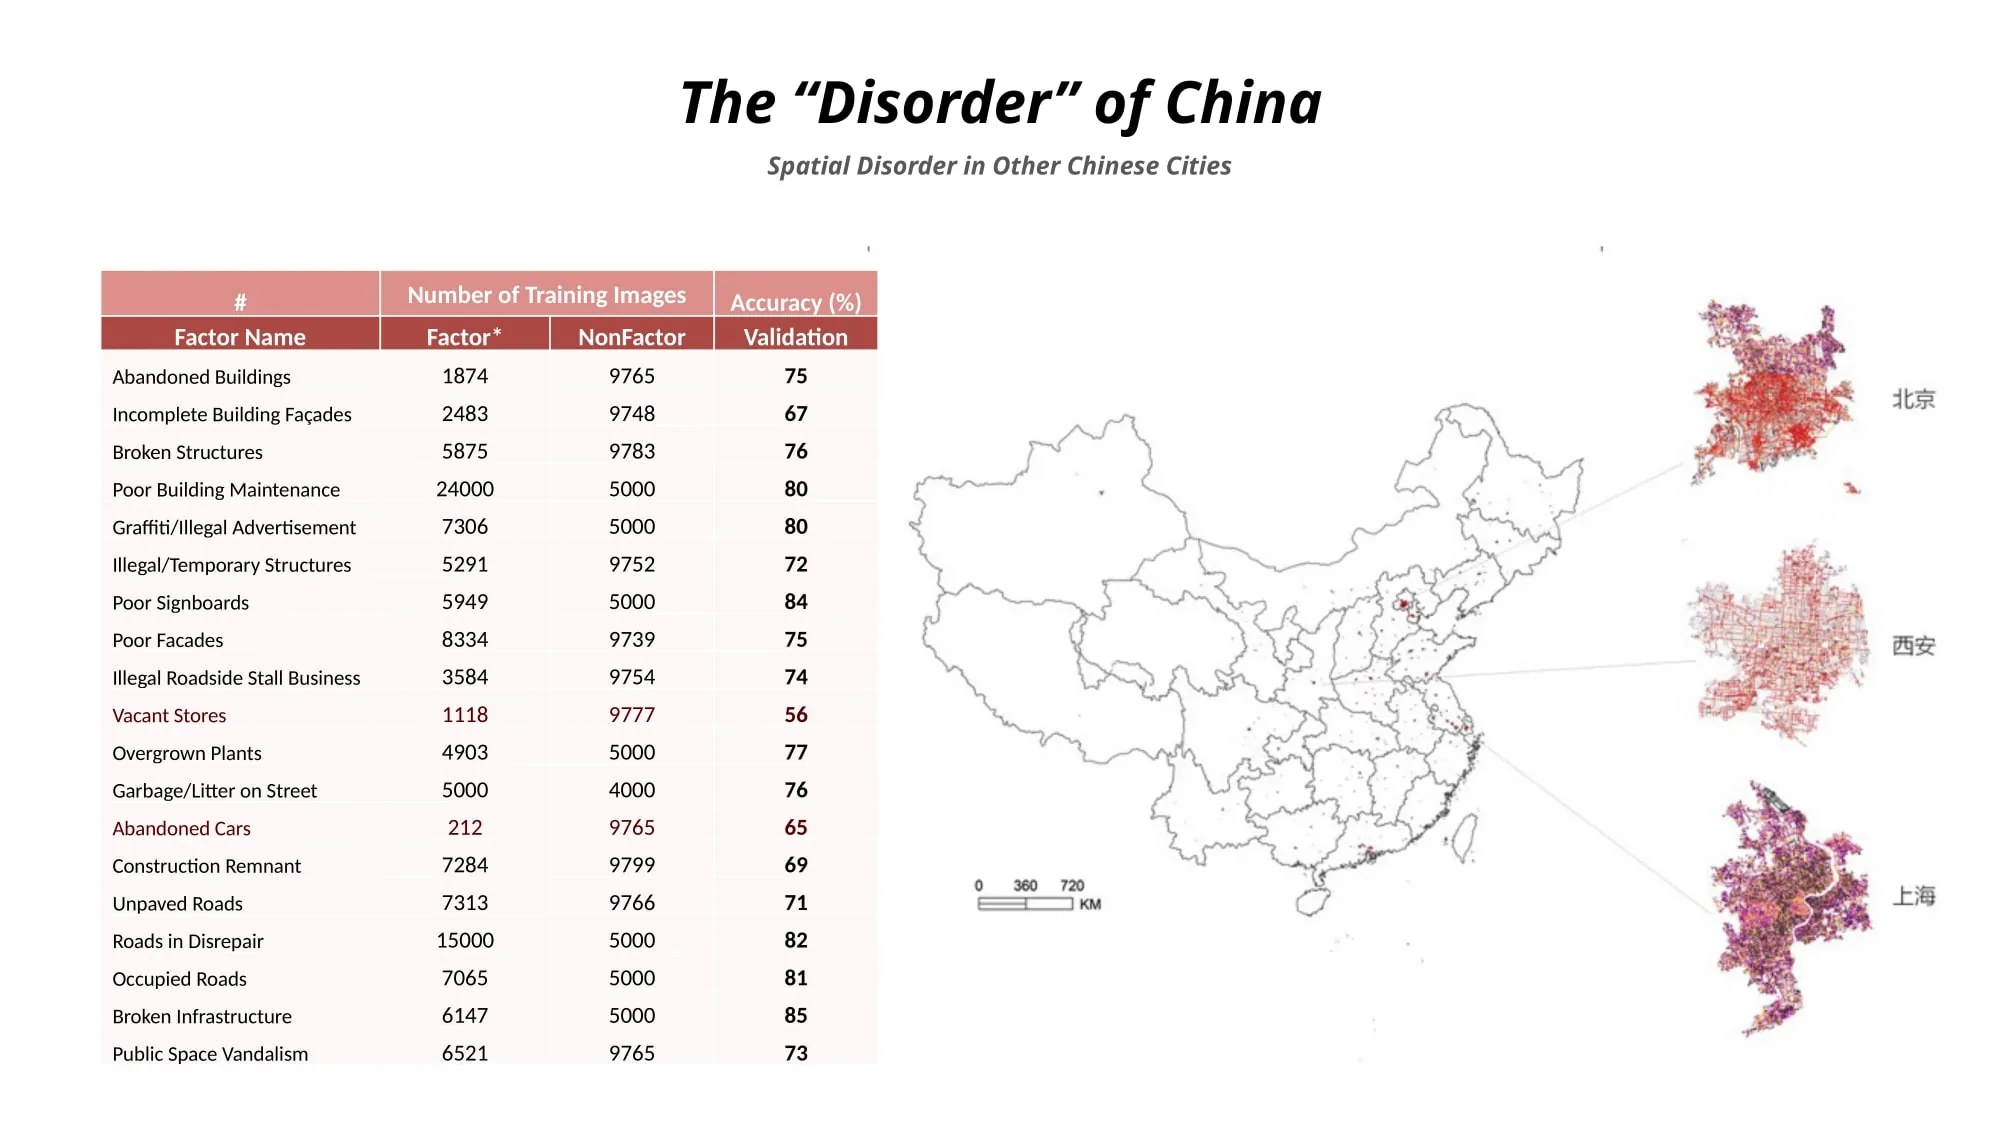
The project proposes a comprehensive framework for identifying urban spatial disorder. It draws on large-scale street-view imagery from Chinese cities — observation points sampled every 100 m along the street network, over four million images from 1.21 million points, retrieved at scale through a map API — and builds a systematic framework of nineteen disorder indicators in five groups: architecture, retail, greening, road and infrastructure. Street-view images within Beijing’s Fifth Ring Road are first labelled by hand on a purpose-built audit platform, each indicator coded present or absent across four viewing directions; image-recognition models trained on that set are then applied to estimate disorder in other cities across China.
Findings
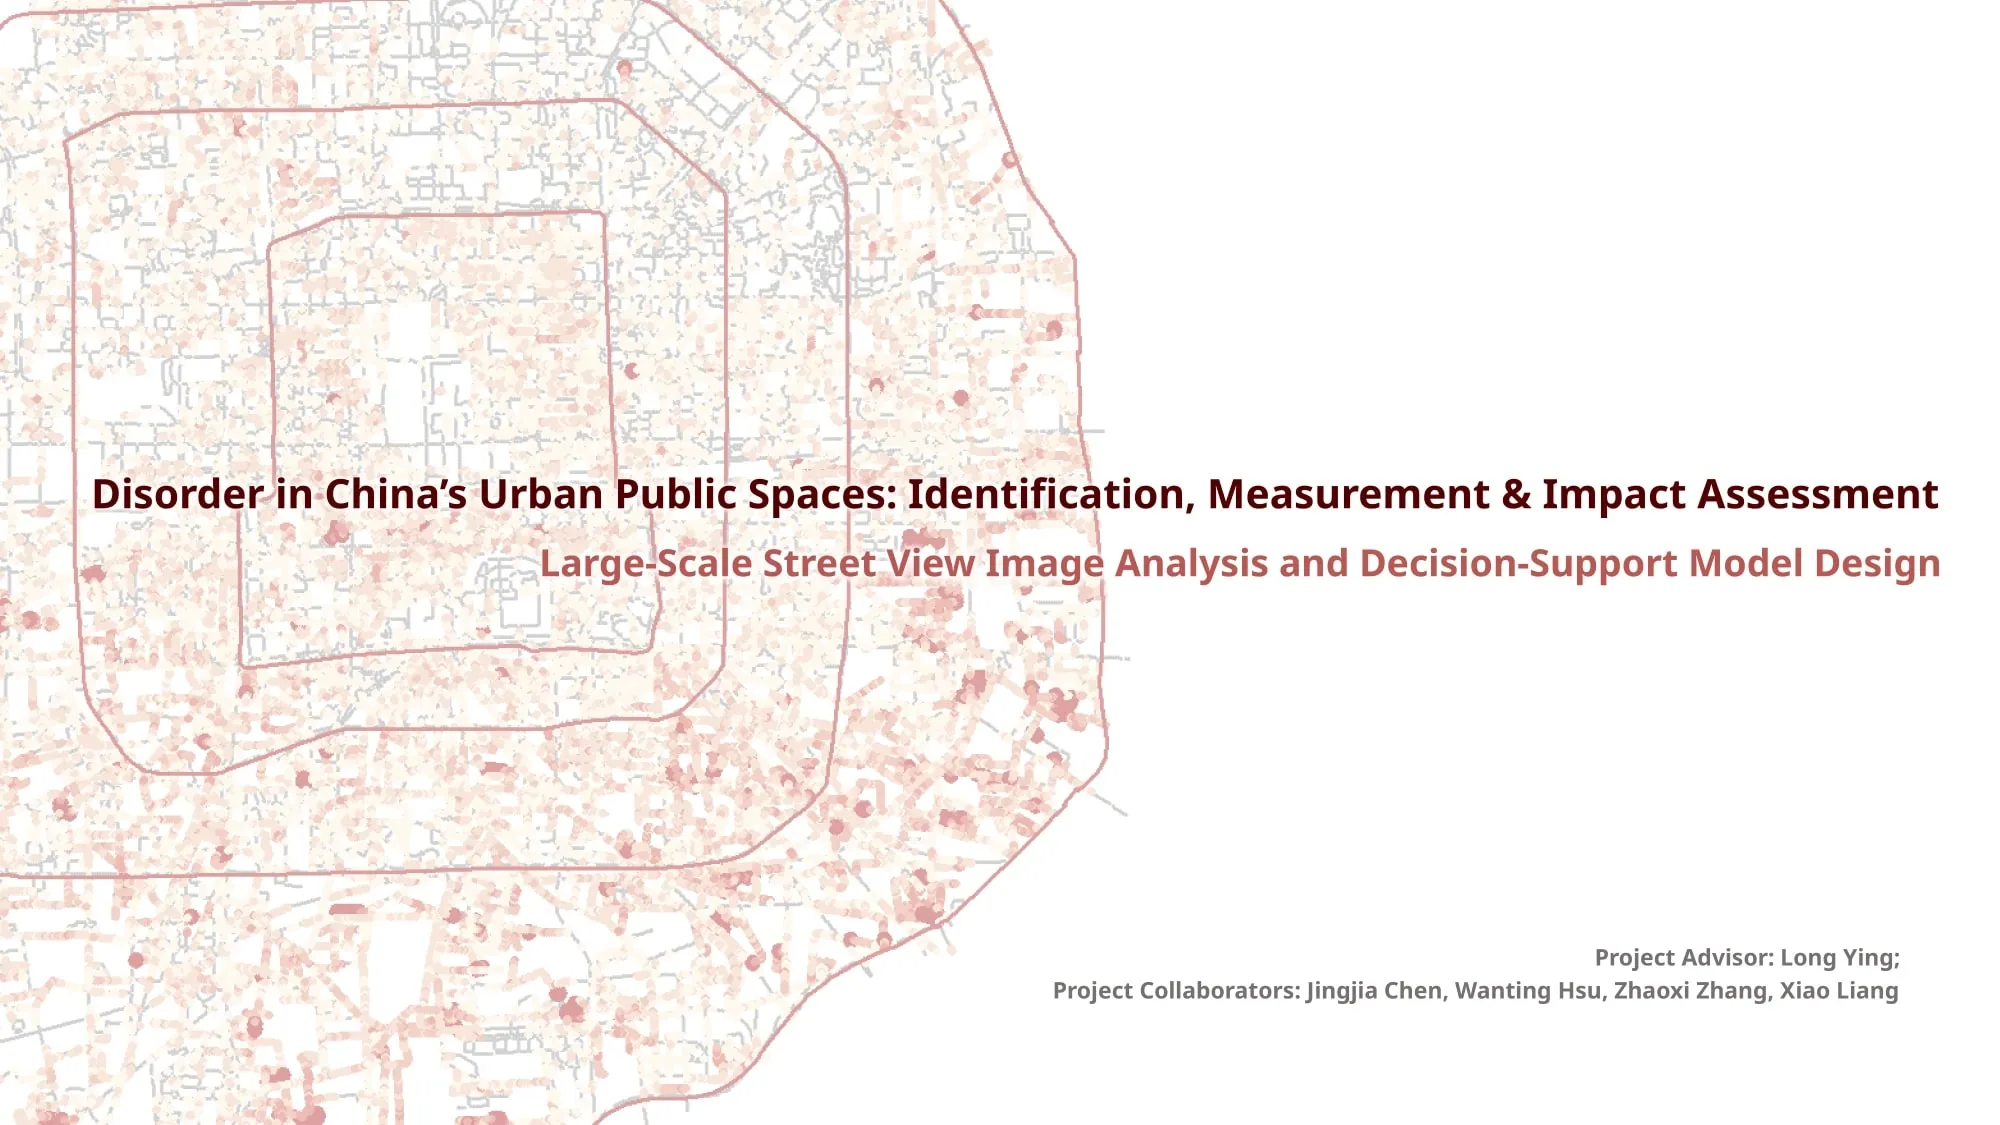
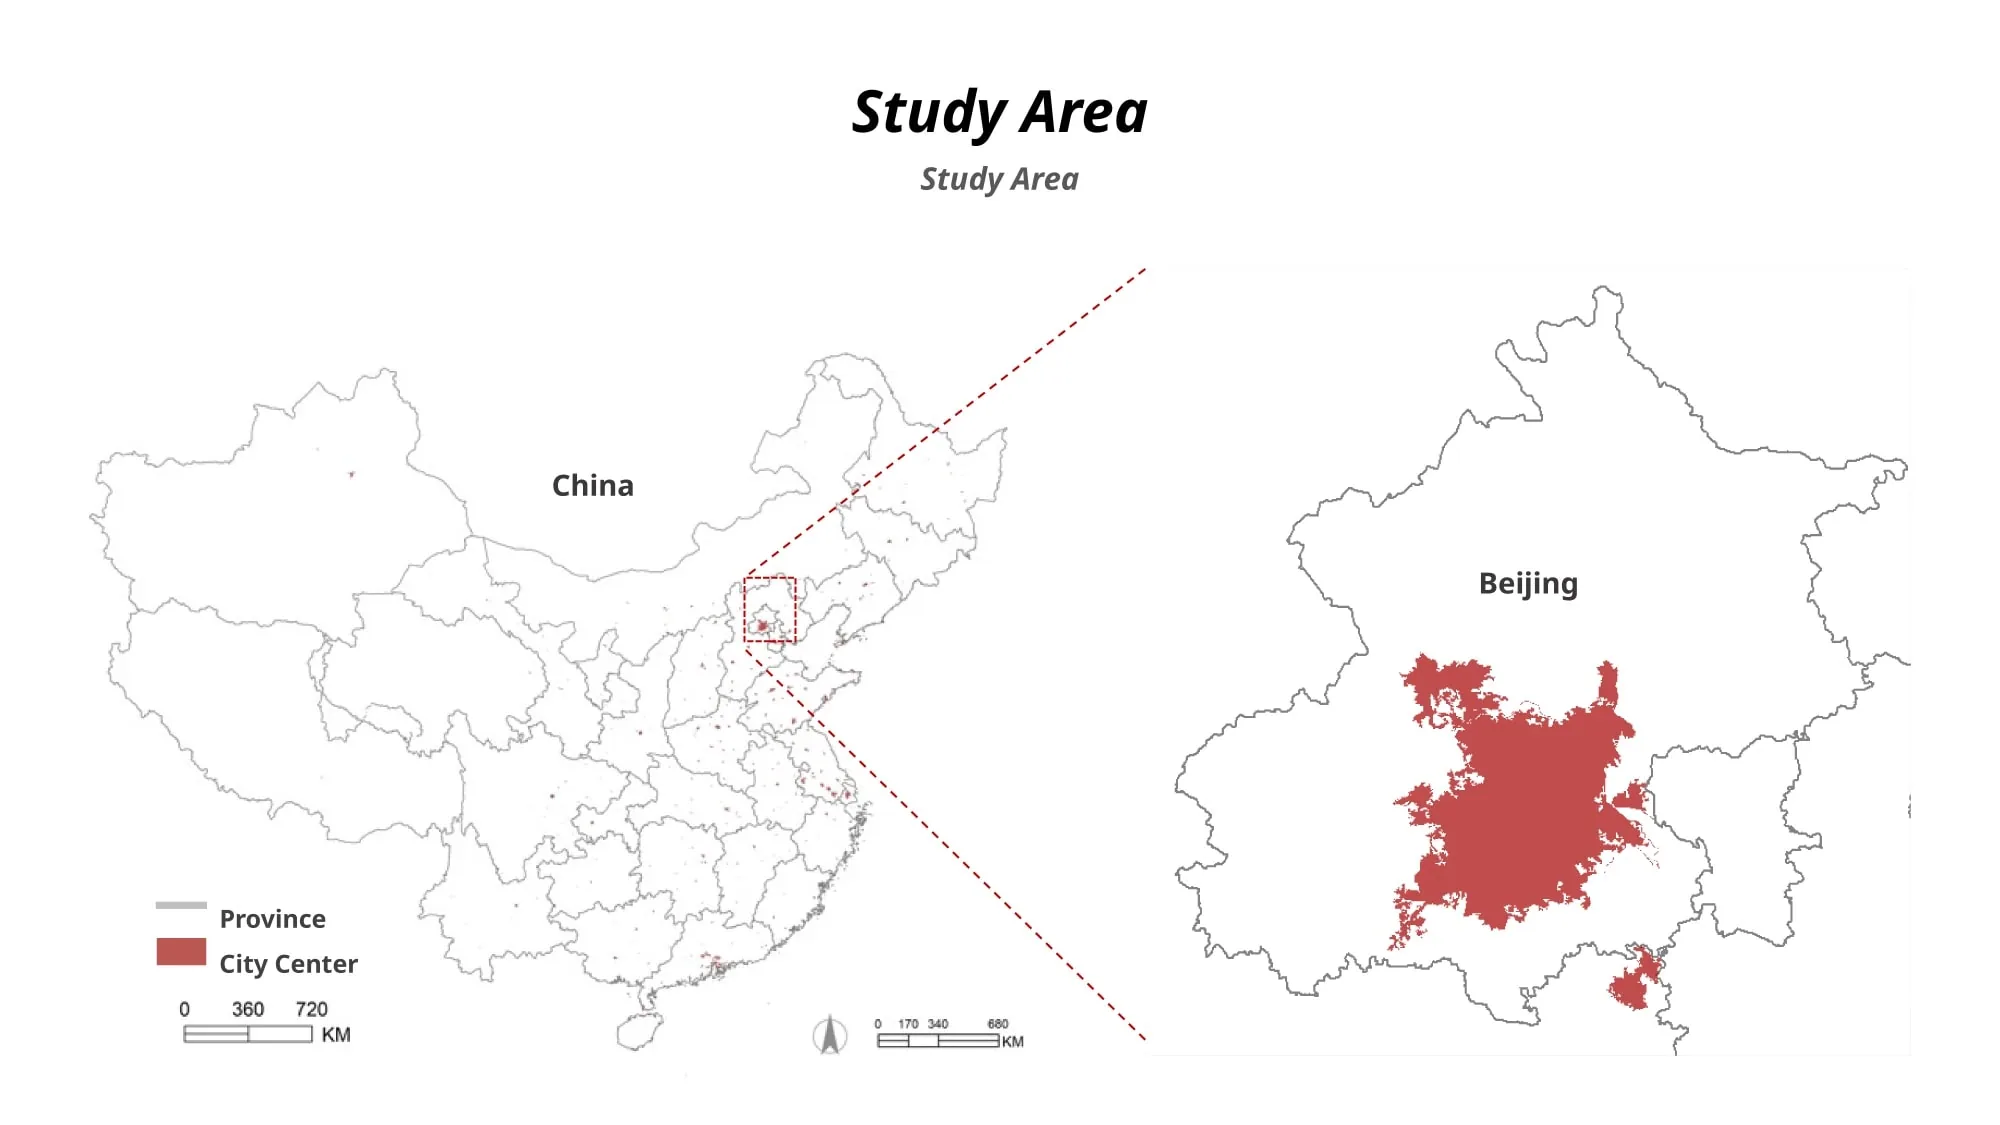
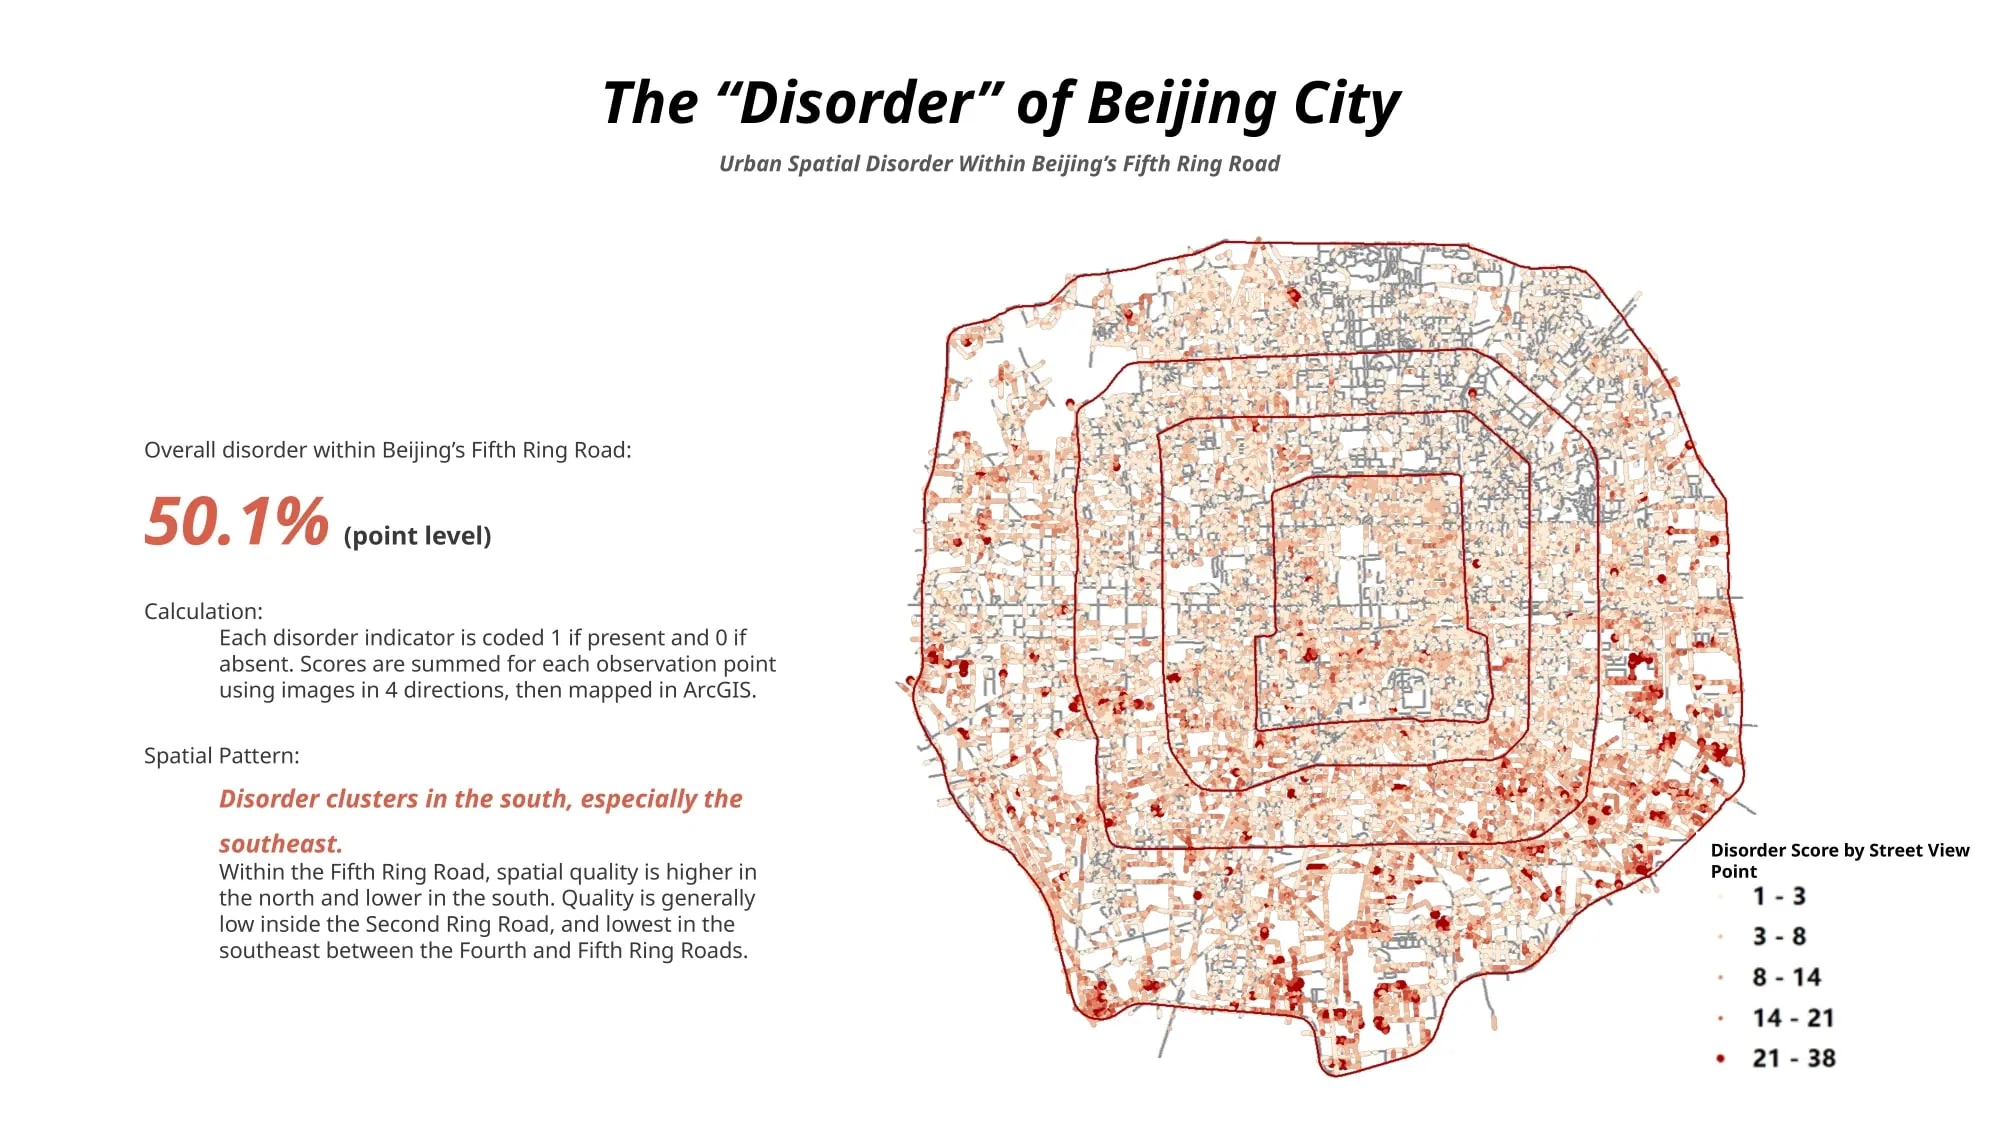
Within Beijing’s Fifth Ring Road, disorder is present at 50.1% of observation points. It clusters in the south and especially the southeast: spatial quality is higher in the north and lower in the south, generally low inside the Second Ring Road, and lowest between the Fourth and Fifth Ring Roads to the southeast.
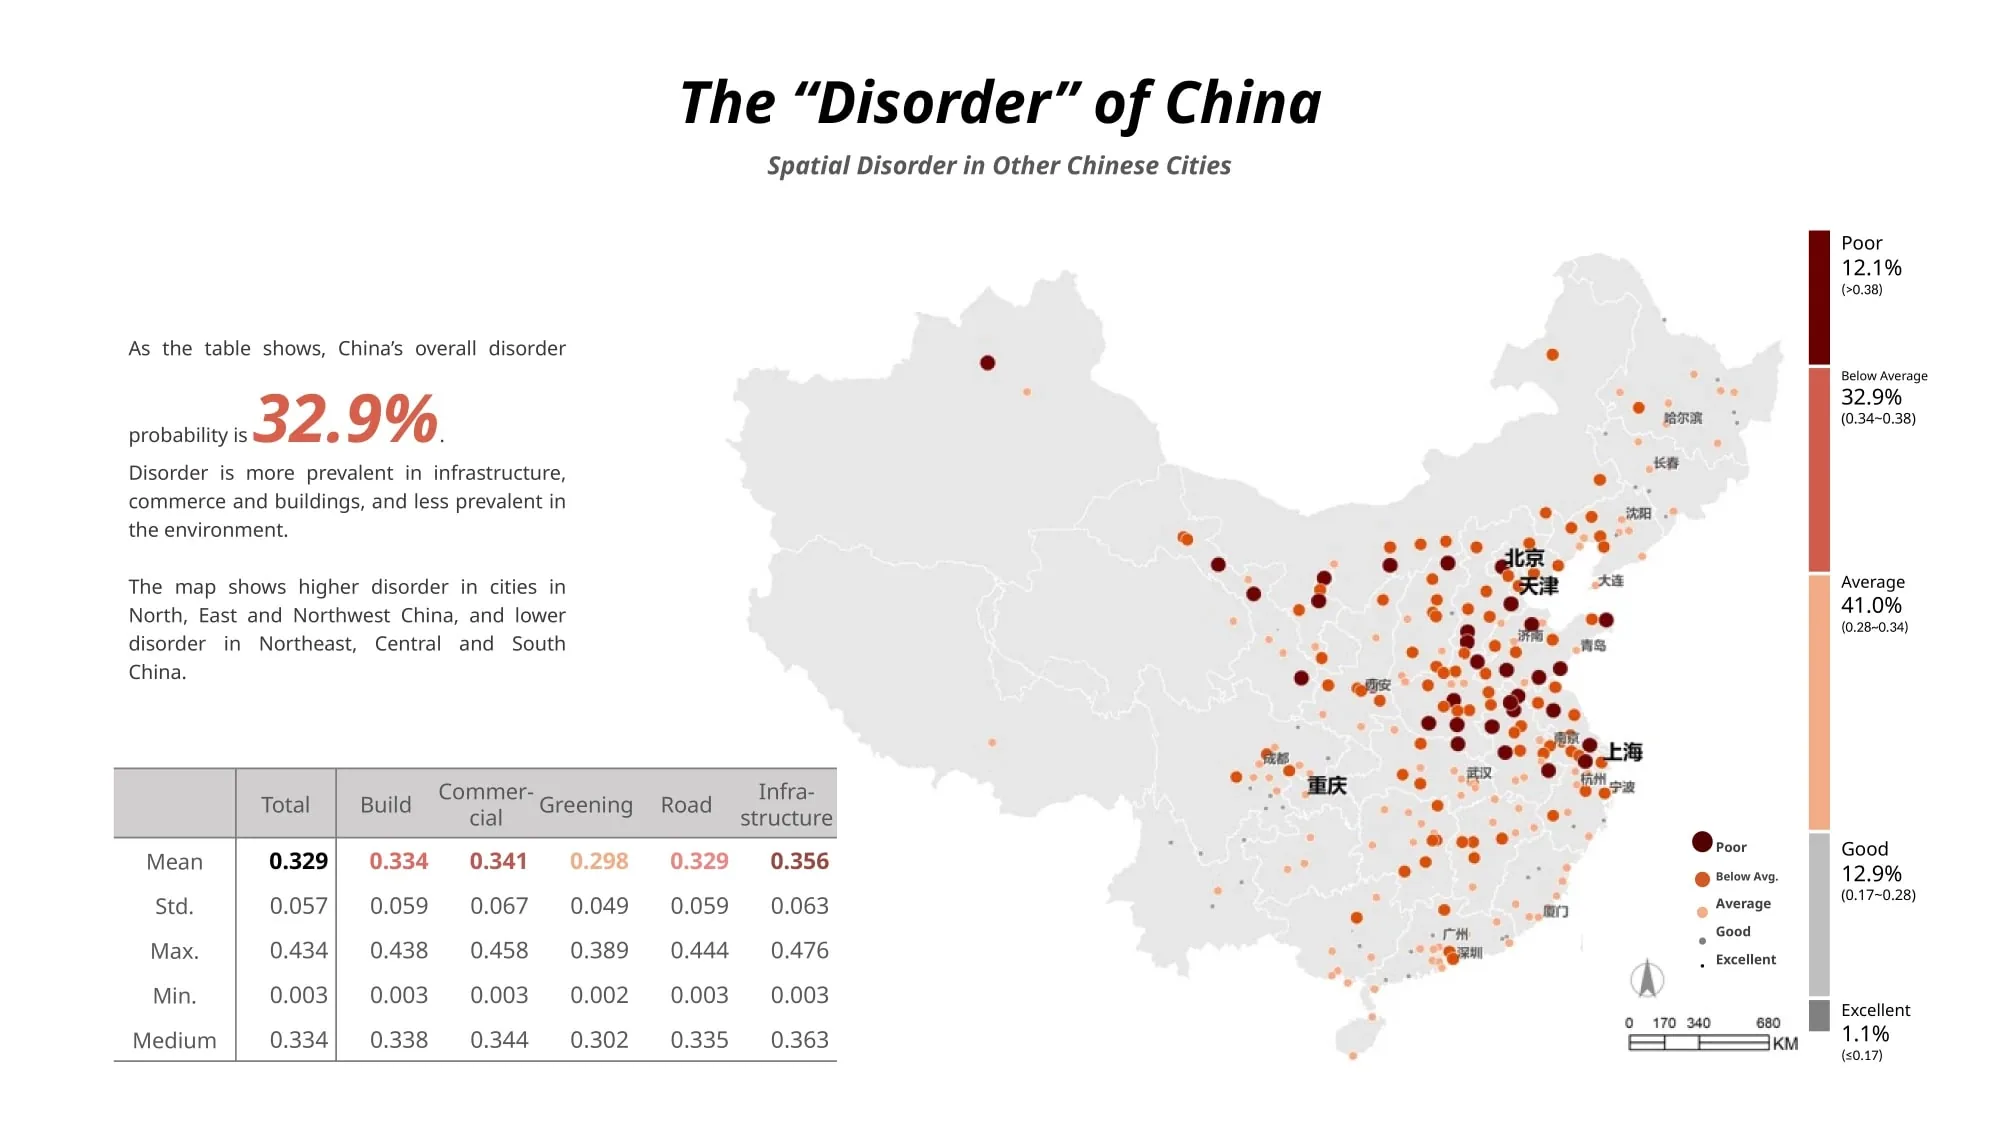
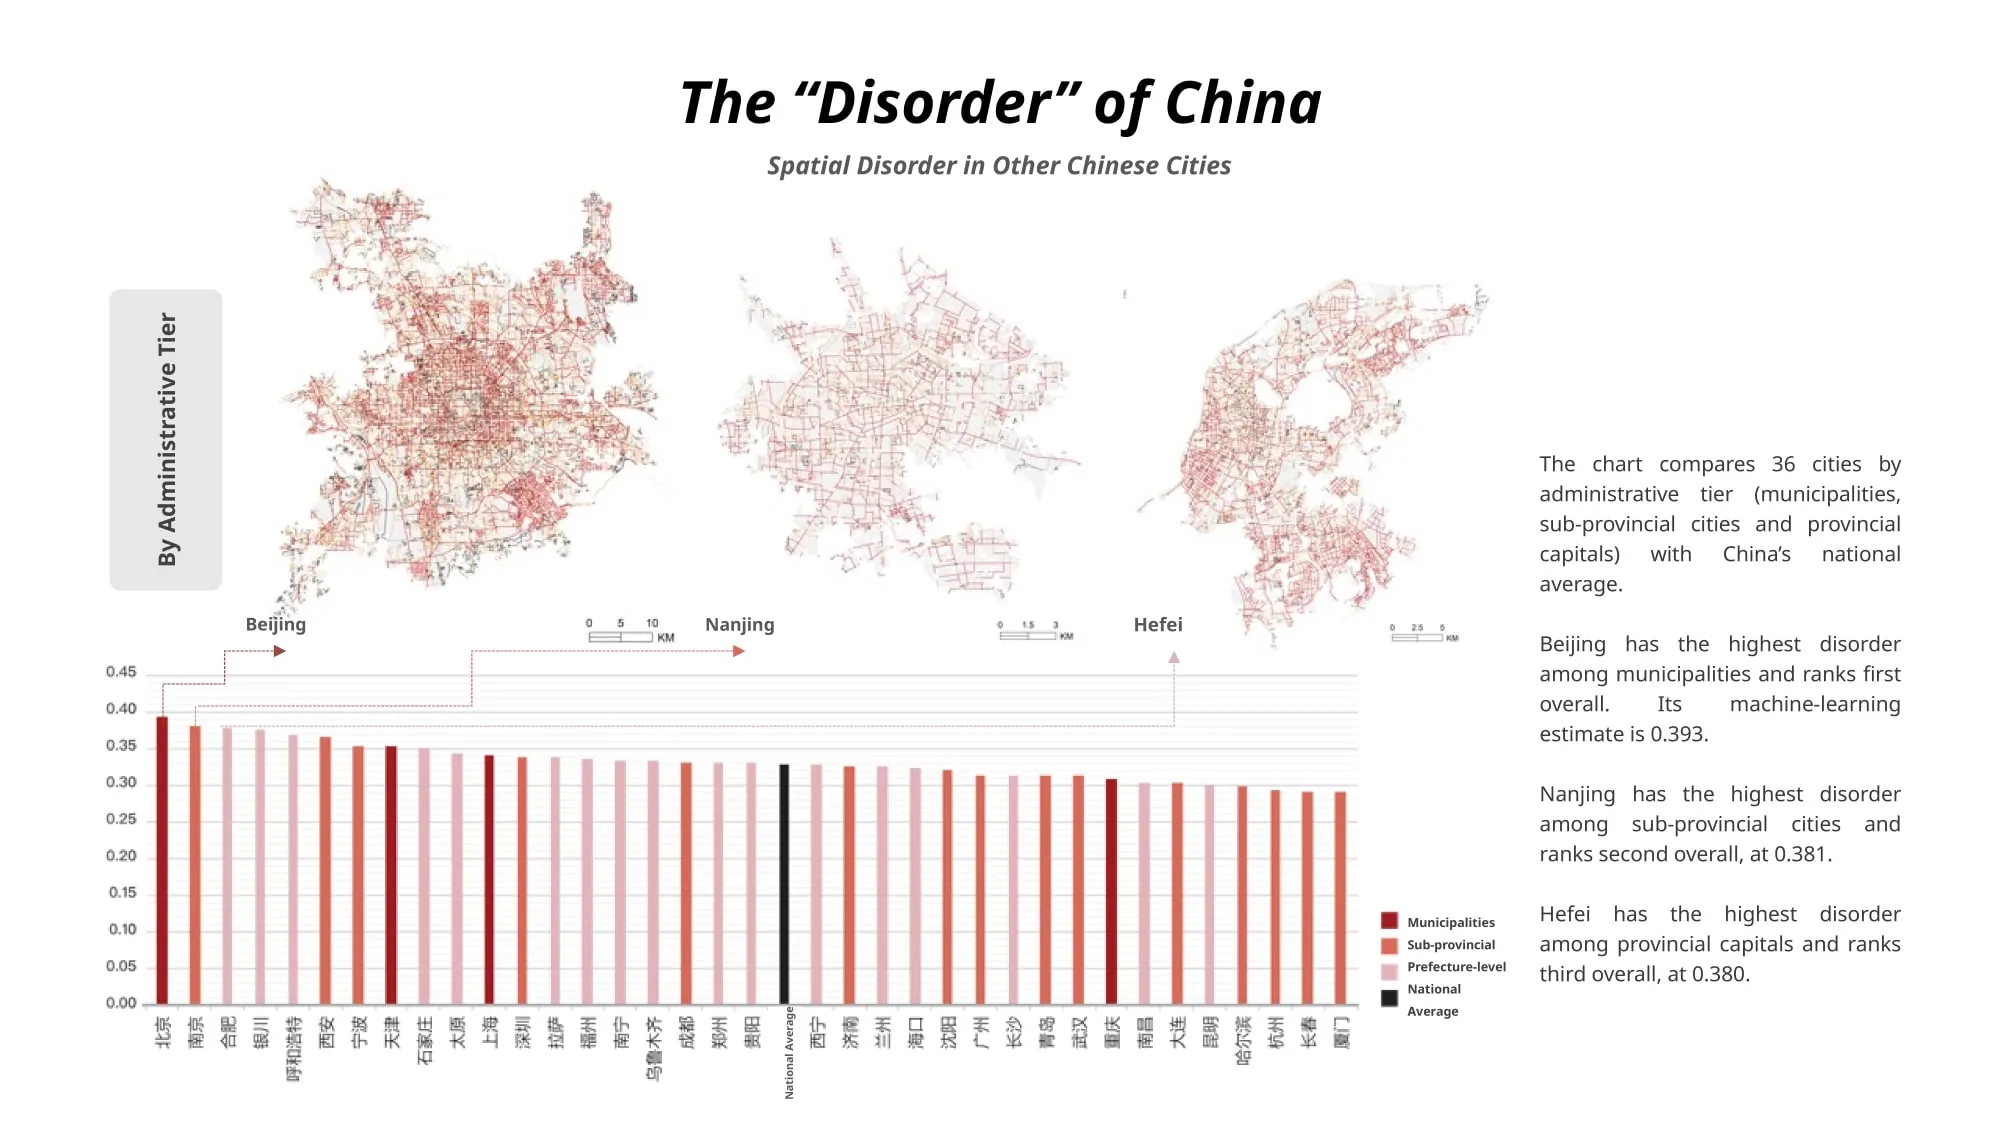
Across China the models put the overall probability of disorder at 32.9%. Disorder is more prevalent in infrastructure, commerce and buildings, and less so in greening; it runs higher in cities of North, East and Northwest China and lower in the Northeast, Central and South. Among the 36 municipalities, sub-provincial cities and provincial capitals compared against the national average, Beijing ranks first (0.393), Nanjing second (0.381) and Hefei third (0.380).
Publication
The wider line of research this project belongs to — reading how Chinese cities are actually built, from street level to city scale, against how they were planned — is published in Habitat International:
Long, Y., Han, H., Lai, S.-K., Jia, Z., Li, W. & Hsu, W. (2020). Evaluation of urban planning implementation from spatial dimension: An analytical framework for Chinese cities and case study of Beijing. Habitat International, 101, 102197. doi:10.1016/j.habitatint.2020.102197
- Advisors
- Long Ying
- With
- Jingjia Chen, Zhaoxi Zhang, Xiao Liang
- Tags
- Spatial Disorder · Image Recognition · Street View Images · Machine Learning